Modern wireless service providers are working to expand bandwidth and provide Internet Protocol (IP) services to more users. Long Term Evolution (LTE) is a next-generation cellular technology that enhances the current deployment of 3GPP networks and creates more and more important applications. The architecture of LTE is complex and evolving, which brings new challenges to the design and testing of networks and user equipment. Among them, a key challenge on the air interface is how to manage power during signal transmission.
In digital communication systems such as LTE, the power of the transmitted signal leaking to the adjacent channel may interfere with the signal transmission in the adjacent channel, thereby affecting system performance. The Adjacent Channel Leakage Power Ratio (ACLR) test verifies that the system transmitter's operating performance meets the specified limits. Given the complexity of LTE technology, performing this critical test quickly and accurately is challenging for testers. Signal generators with LTE-specific signal generation software, modern signal analyzers with LTE-specific measurement software, and methods optimized for this analyzer can help testers overcome this challenge.
Understand the ACLR test requirements
ACLR is an important transmitter feature in LTE RF Transmitter Conformance Testing. The purpose of these tests is to verify that the device under test meets the minimum requirements in the base station (eNB) and user equipment (UE). Most LTE conformance tests for out-of-band emissions are similar in definition and purpose to conformance testing for WCDMA. However, WCDMA specifies the use of a root raised cosine (RRC) filter for transmitter measurements, while the standard does not define an equivalent filter for LTE. Therefore, LTE transmitter testing can use different filters to optimize channel in-band performance, improve error vector magnitude, optimize channel out-of-band performance, and achieve better adjacent channel power characteristics.
Given the many configurations of complex transmitters that can be used in testing transmitter performance, LTE specifies a range of downlink signal configurations to test the eNB. These configurations are called E-UTRA Test Models (E-TM). They can be divided into three main categories: E-TM1, E-TM2, and E-TM3. The first and third categories can be subdivided into E-TM1.1, E-TM1.2, E-TM3.1, E-TM3.2 and E-TM3.3. Note: The “E†in E-UTRA is derived from “enhanced†and refers to LTE UMTS terrestrial radio access; the separate UTRA refers to WCDMA.
The ACLR test requirements vary depending on whether the transmitter test is on the UE or on the eNB. The ACLR test performed on the UE is not as demanding as it is on the eNB. Transmitter testing is performed using a Reference Measurement Channel (RMC) specified for eNB receiver testing.
The 3GPP LTE specification defines ACLR as the ratio of the filtered average power centered on the specified channel frequency to the filtered average power centered on the adjacent channel frequency. The minimum ACLR conformance requirements of the eNB are divided into two scenarios: the adjacent E-UTRA channel carrier of the same bandwidth (E-UTRAACLR1); the UTRA neighboring and inter-phase channel carriers (UTRAACLR1 and UTRAACLR2, respectively).
Different limiting and measurement filters are defined for E-UTRA and UTRA adjacent channels for paired spectrum (FDD) and unpaired spectrum (TDD) operation. The E-UTRA channel is measured using a squared measurement filter, while the UTRA channel is measured using a RRC filter with a roll-off factor of 0.22 and a bandwidth equal to the chip rate.
Defeat the ACLR measurement challenge
In view of the complexity of LTE technology and the complexity of transmitter configurations used to test transmitter performance, conforming to standard spectrum measurements (such as ACLR) can be cumbersome. Fortunately, the advent of advanced signal measurement tools enables engineers to make these LTE measurements quickly and accurately. Power measurements (including ACLR) are typically performed using a spectrum analyzer or signal analyzer that uses the test signal generated by the signal generator.
To better illustrate how to use these instruments, consider the following scenario: According to the specification, the carrier frequency must be set in the frequency band supported by the base station under test, as specified in the working of paired spectrum FDD or unpaired spectrum TDD. Measure the ACLR of a certain frequency offset on both sides of the channel frequency. The test is first performed using the E-TM 1.1 transmit signal, where all PDSCH resource blocks have the same power. The test is then performed using the E-TM 1.2 signal (increasing and decreasing power). The E-TM1.2 configuration is very useful because it can emulate multiple users (whose devices work on different powers). The result of this scenario is a higher crest factor, making it more difficult to amplify the signal without generating additional invalid spectral content (such as ACLR).
In this example, Agilent's LTE-enabled Signal Studio is connected to the Agilent MXG signal generator to generate a standard E-TM 1.2 test signal with a frequency set to 2.11 GHz. The output signal amplitude - an important consideration in determining ACLR performance - is set to -10dBm. Select a 5MHz channel bandwidth from a bandwidth of 1.4 to 20MHz.
Figure 1 shows the eNB settings for the selected Transport Channel. The bottom is the resource allocation block diagram for the test signal. Channels 1 and 2 are the channels to be measured and they share the downlink.
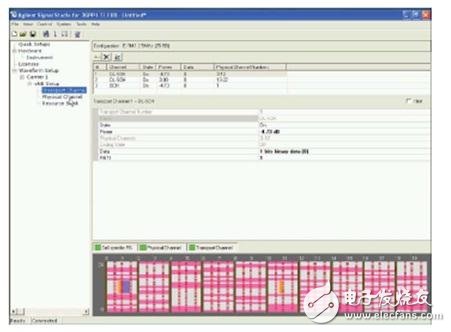
Figure 1. The resource allocation block (bottom) of the E-TM 1.2 test signal is shown here. The Y axis represents a frequency or resource block, the X axis represents a time slot or time, the white area represents channel 1, the pink area represents channel 2, and the other colors represent synchronization channels, reference signals, and the like.
Channel 1 has an output power level of -4.3 dB and its channel power has been reduced. The output power of channel 2 has been increased and set to 3dB. Complex power increase and decrease options can be set for different resource blocks in the resource block allocation map. The resulting composite signal has a higher peak-to-average ratio than a single channel where all resource blocks are at the same power level. Amplifying such increased power signals can be very difficult. There is not enough power back-off in the power amplifier, which can cause clipping.
Slaughtering Hemp Motor Power Supply,Slaughter Power Supply,Slaughtering Hemp Motor Frequency Converter,The Slaughtering Power Supply
Jinan Xinyuhua Energy Technology Co.,Ltd , https://www.xyhenergy.com